Luminaire and lamp manufacturers provide candlepower (or luminous intensity) distribution curves for their light fixtures. The light distribution curves provide the designer with important information about the way light is distributed from the fixture and also how that light falls upon a surface. This article helps you understand how to read a light distribution curve.
Candlepower Distribution Curve
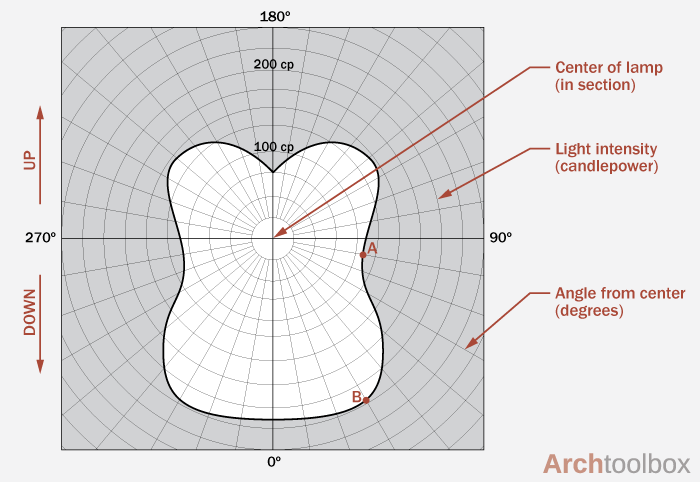
The image below is a candle power distribution curve, which provides information on how light is emitted from a lamp or light fixture. Each part of the light fixture can affect how light is emitted from the fixture.
The diagram represents a section cut through the fixture and shows the intensity of light emitted in each direction. The portion of the graph above the horizontal 90°-270° line indicates light that shines above the fixture (indirect), while the portion of the graph below represents light shining down (direct).
The straight lines radiating from the center point identify the angle of the light emitted while the circles represent the intensity. For instance, point A above shows that the intensity of light at 80° is approximately 110 candlepower. Point B shows that at 30° you will get about 225 candlepower.
Isochart
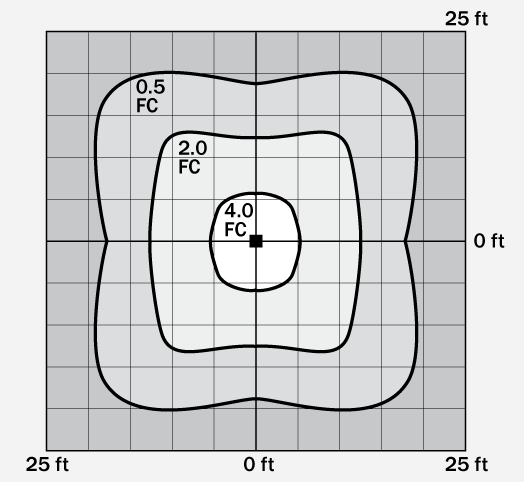
The diagram above provides information on the distribution of light in plan. The isochart (or iso-lux/iso-candlepower) is useful for determining how much area a light fixture can cover. For instance, in a parking lot, the diagram at left indicates that there will be about 1/2 of a foot-candle of light at about 18-20 feet from center. If 1/2 foot-candle is acceptable, then the fixtures can be placed about 36-40 feet apart.
Photometric Data Files
Information about a fixture's light distribution is also generally available in a file format that can be loaded into an analysis or rendering program and used to help better understand the lighting within a space. There are a number of different file types, the most popular of which are listed below.
IES is the international standard file type for providing luminaire light distribution information. The standard was developed by the Illuminating Engineering Society of North America (IESNA), which has simply become the Illuminating Engineering Society. IES files have a .ies file extension.
EULUMDAT is the main format used in Europe. The standard was originally developed in Germany, but there is currently no official documentation on the format. EULUMDAT files have an .ldt file extension.
CIBSE is a format used primarily in Great Britain and is published by the Chartered Institution of Building Service Engineers. CIBSE files have a .cibse file extension.
LTLI is a format occasionally used with Autodesk products such as 3ds Max. LTLI was developed by the Danish Illuminating Laboratory and is the standard used in Scandinavian countries. LTLI files have an .ltli file extension.